The current blog you are going to read is giving you information regarding the most traded goods in India via import/export. The data depicted are based on the exchange rate of the fiscal year 2019.
India imported US$480 billion worth of goods from around the globe in 2019, up by 22.8% since 2015 but down by -5.7% from 2018 to 2019.
Strategically located near highly populated trading partners including China, Pakistan and Bangladesh, the Republic of India shipped US$322.8 billion worth of goods around the globe in 2019. That dollar amount reflects a -0.4% reduction since 2015 but a 22.3% gain from 2018 to 2019.
Let's separately understand the values of exports and imports.
India’s Top Imports
The following product categories represent the highest dollar value in India’s import purchases during 2019. Also depicted is the percentage share each product category represents in terms of overall imports into India.
- Mineral fuels including oil: US$153.5 billion (32% of total imports)
- Gems, precious metals: $60 billion (12.5%)
- Electrical machinery, equipment: $50.4 billion (10.5%)
- Machinery including computers: $44.1 billion (9.2%)
- Organic chemicals: $20.5 billion (4.3%)
- Plastics, plastic articles: $14.6 billion (3.1%)
- Iron, steel: $11.6 billion (2.4%)
- Animal/vegetable fats, oils, waxes: $9.6 billion (2%)
- Optical, technical, medical apparatus: $9.5 billion (2%)
- Fertilizers: $7.3 billion (1.5%)

Imported fertilizers posted the fastest increase in value among India’s top 10 import categories, up 23.3% from 2018 to 2019. The other top category to gain was machinery including computers via a 1.6% improvement.
Leading the decliners were organic chemicals (down -9.3%), mineral fuels including oil (also down -9.3%) then gems and precious metals (down -7.8%).
Leading the decliners were organic chemicals (down -9.3%), mineral fuels including oil (also down -9.3%) then gems and precious metals (down -7.8%).
India’s Top Exports
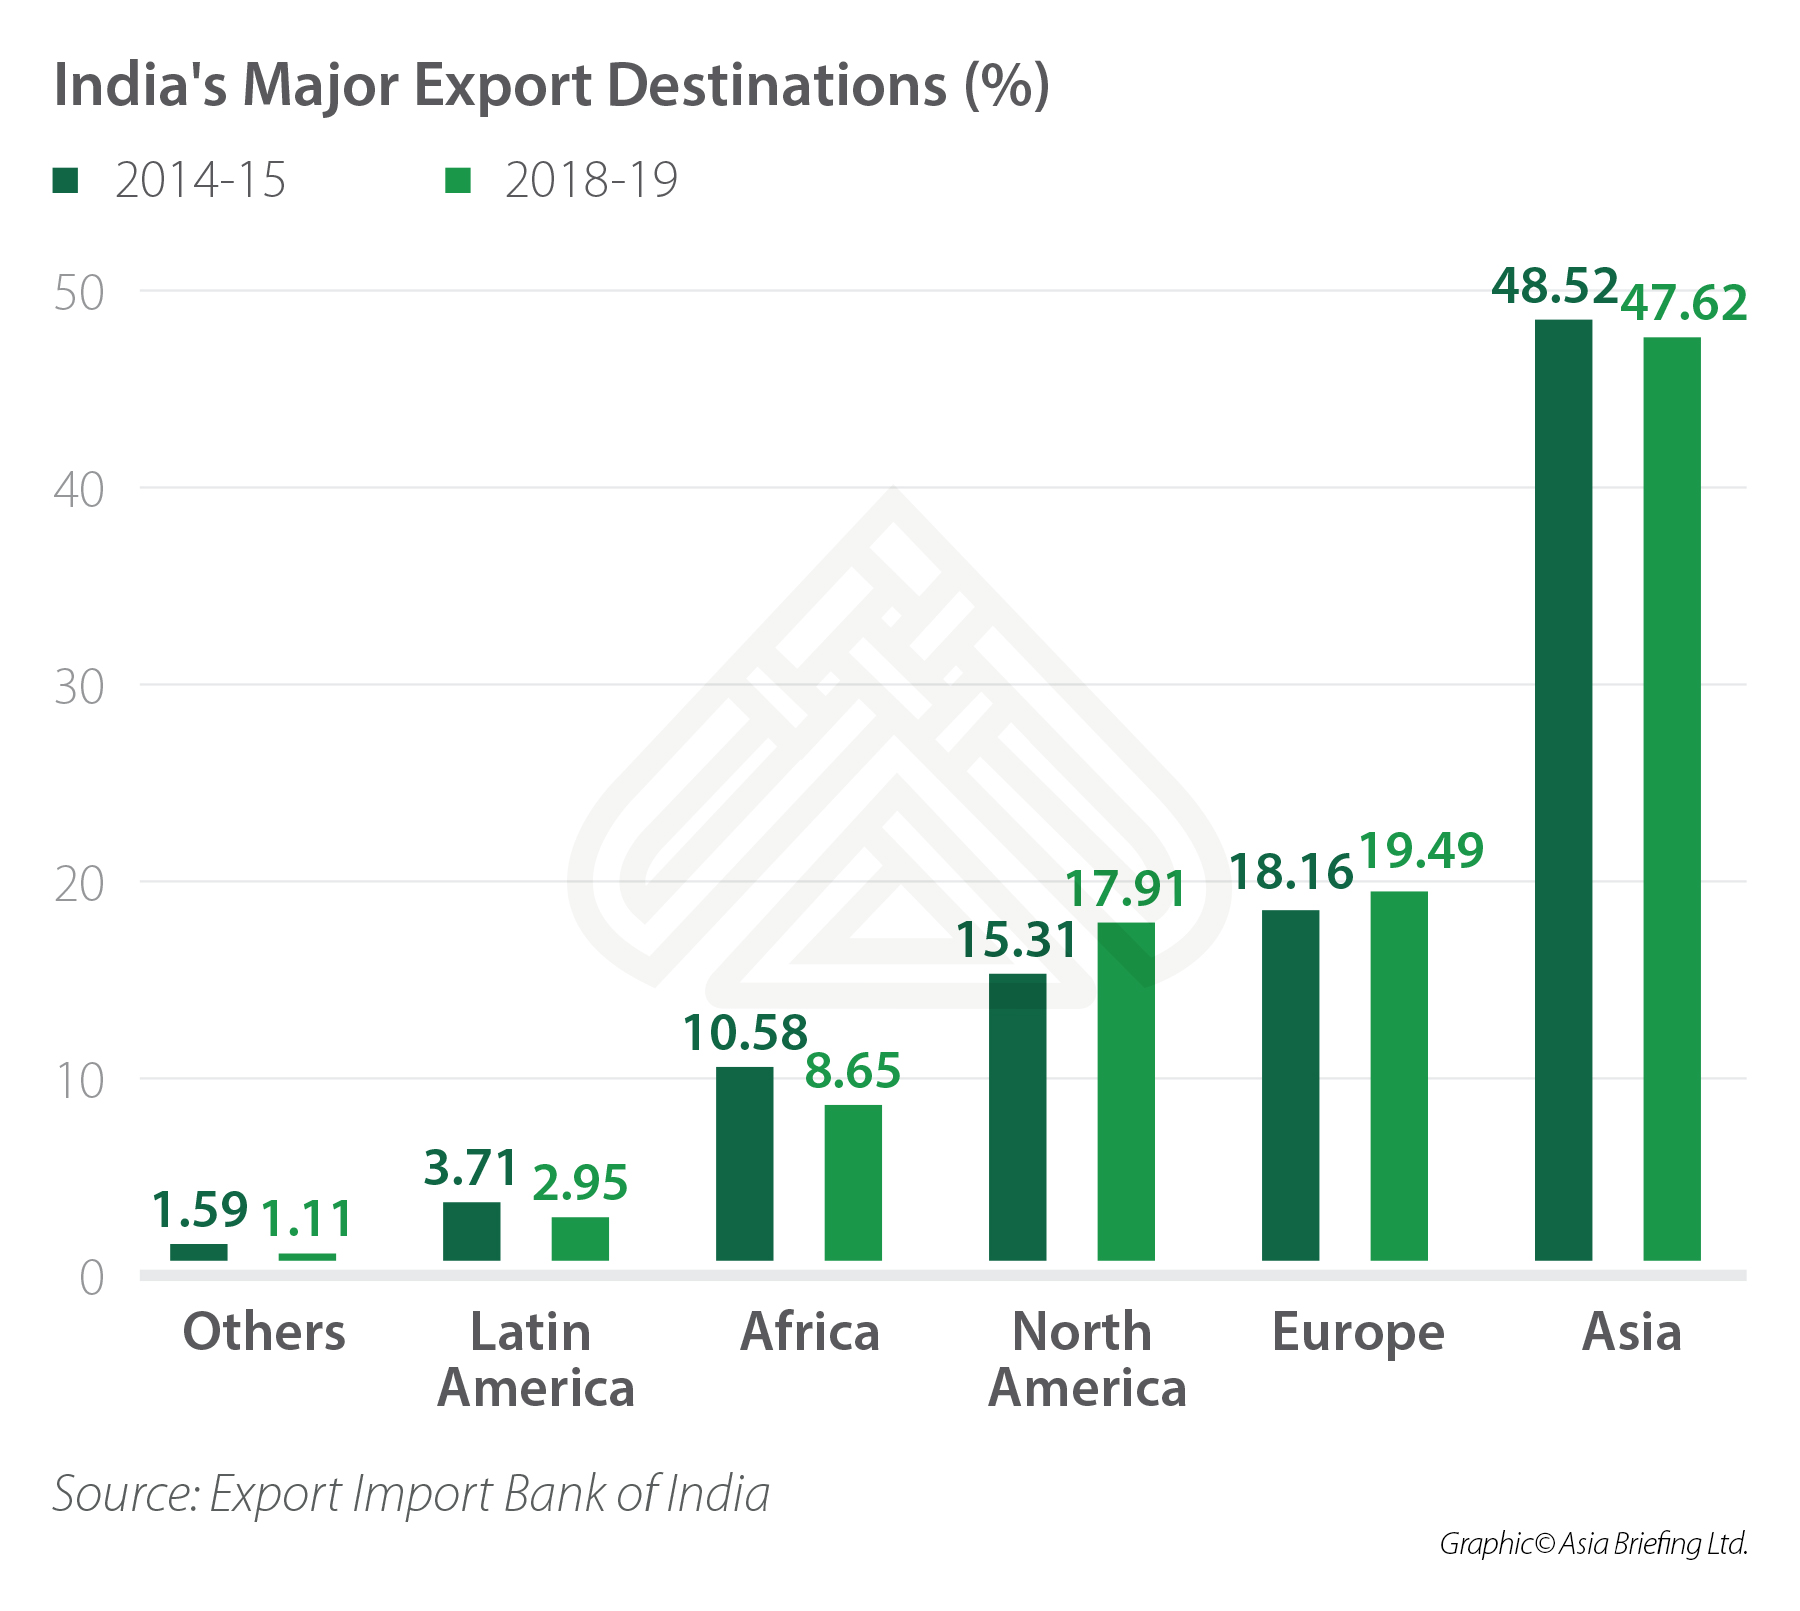
From a continental perspective, 47.62% of India’s exports by value were delivered to fellow Asian countries while 19.49% were sold to European importers. India shipped another 17.91% worth of goods to North America. Smaller percentages went to Africa (8.65%), Latin America excluding Mexico but including the Caribbean (2.95%), and Oceania led by Australia (1.1%).
The following export product groups categorize the highest dollar value in Indian global shipments during 2019. Also shown is the percentage share each export category represents in terms of overall exports from India.
- Mineral fuels including oil: US$44.1 billion (13.7% of total exports)
- Gems, precious metals: $36.7 billion (11.4%)
- Machinery including computers: $21.2 billion (6.6%)
- Organic chemicals: $18.3 billion (5.7%)
- Vehicles: $17.2 billion (5.3%)
- Pharmaceuticals: $16.1 billion (5%)
- Electrical machinery, equipment: $14.7 billion (4.5%)
- Iron, steel: $9.7 billion (3%)
- Clothing, accessories (not knit or crochet): $8.6 billion (2.7%)
- Knit or crochet clothing, accessories: $7.9 billion (2.5%)
Electrical machinery and equipment represents the fastest growing among the top 10 export categories, up 23.6% from 2018 to 2019. In second place for improving Indian export sales were pharmaceuticals which gained 12.5%.
Products in more demand for export from India-2019
In macroeconomic terms, India’s total exported goods represent 2.9% of its overall Gross Domestic Product for 2019. Some of the products gained huge demand, however some were ignored for the fact that they were lesser in demand than others.
Let's have a look at the products that saw huge change in value since 2018.
- Light vessels, fire boats, floating docks that saw a change of approximately +108.9% compared to 2018 with trade value approximately INR 32,484 Crores.
- Phone system devices including smartphones that saw a change of approximately +101.1% compared to 2018 with trade value approximately INR 31,252 Crores.
- Sugar (cane or beet) that saw a change of approximately +89.4% compared to 2018 with trade value approximately INR 13,378 Crores.
- Cruise/cargo ships, barges that saw a change of approximately +87.7% compared to 2018 with trade value approximately INR 8,051 Crores.
- Iron ores, concentrates that saw a change of approximately +75.4% compared to 2018 with trade value approximately INR 16,726 Crores.
- Electric motor parts that saw a change of approximately +41.2% compared to 2018 with trade value approximately INR 5,180 Crores.
- Essential oils that saw a change of approximately +40.1% compared to 2018 with trade value approximately INR 9,158 Crores.
For any queries/information, leave your comments in the section below.
You can also read our other posts. Click here.
You can also read our other posts. Click here.
